Starting a rental business comes with its fair share of head-scratchers, and figuring out how to price your stuff – especially what to charge for labor – tops the list. Why? A couple of reasons. First, math is hard. It’s even tougher when you need to balance covering your overhead and labor costs, making a profit, and trying not to scare your customers away. Sometimes, figuring this part out can cause stress for business owners or feel downright impossible.
And yet, getting this part right is crucial for your rental company’s success. So what do you do? In this blog, we’ll dive into common approaches taken to pricing labor and share some tips and tricks that will help you hit that perfect balance!

Table of Contents
Common Approaches to Pricing Labor
When it comes to pricing your labor or services, there are a few factors you must always consider:
- How much does the service cost your business?
- What do customers think the service is worth?
- How much are your competitors charging?
Since these three questions are so important, they are the pillar points for the most common approaches to pricing labor in the rental market.
Cost-Based Pricing
Figure out how much the labor costs your business. Do you pay your workers an hourly wage? Do your workers have to use a company vehicle to perform the service? What tools do you use for the service, and how much did it cost to acquire them?
Crunch these numbers. It is extremely important to understand what a service is costing you because you will always need to charge more than it costs to perform the labor.
Value-Based Pricing
Do some research and figure out how in-demand the service is. Is it a premium service that customers are willing to pay more for, or is it something that doesn’t take much skill? This is also known as “Value Based Pricing”, which means that you price the service according to market worth.
Competitor-Based Pricing
Do some digging and find out what your competitors are charging. While you don’t always need to charge less than competitors – the saying goes, “You get what you pay for” – it is good to know whether your prices are significantly different. When you know how much competitors are charging, you can re-evaluate your pricing strategy to make sure that it is competitive.
What Approach Is The Best?
The best approach to pricing takes all three of the above factors into account.
If you charge more than a customer believes the service is worth, they won’t order from you. If you charge too low, they may not order from you because they fear your work will not be quality.
And if you don’t consider your competitors’ prices, you may lose out if their packages are more attractive.
But ultimately, understanding your labor costs is inarguably the most important factor to consider if you want to avoid losing money.

Understanding Labor Costs
This gets tricky in a rental company where everyone does a variety of tasks, from counting inventory to chatting with customers. It’s not as straightforward as a factory job where someone earns a set wage for repeating the same task. Each order and day brings new challenges, making it tough to pin down your exact costs.
There are two types of costs you should account for:
- Fixed Costs: These are expenses that stay the same, no matter how many orders you receive. Fixed labor costs include managers’ salaries, guaranteed hours for employees, and employee benefits.
- Variable Costs: These costs go up as you get more orders. Examples of variable labor costs include the time it takes to prepare orders, deliver them, and set up or take down items for customers.
Why Fixed and Variable Expenses Matter
Your labor expenses combine both fixed and variable costs. You’ll have fixed costs even if you don’t process any orders, and your variable costs will rise with the number of orders you handle.
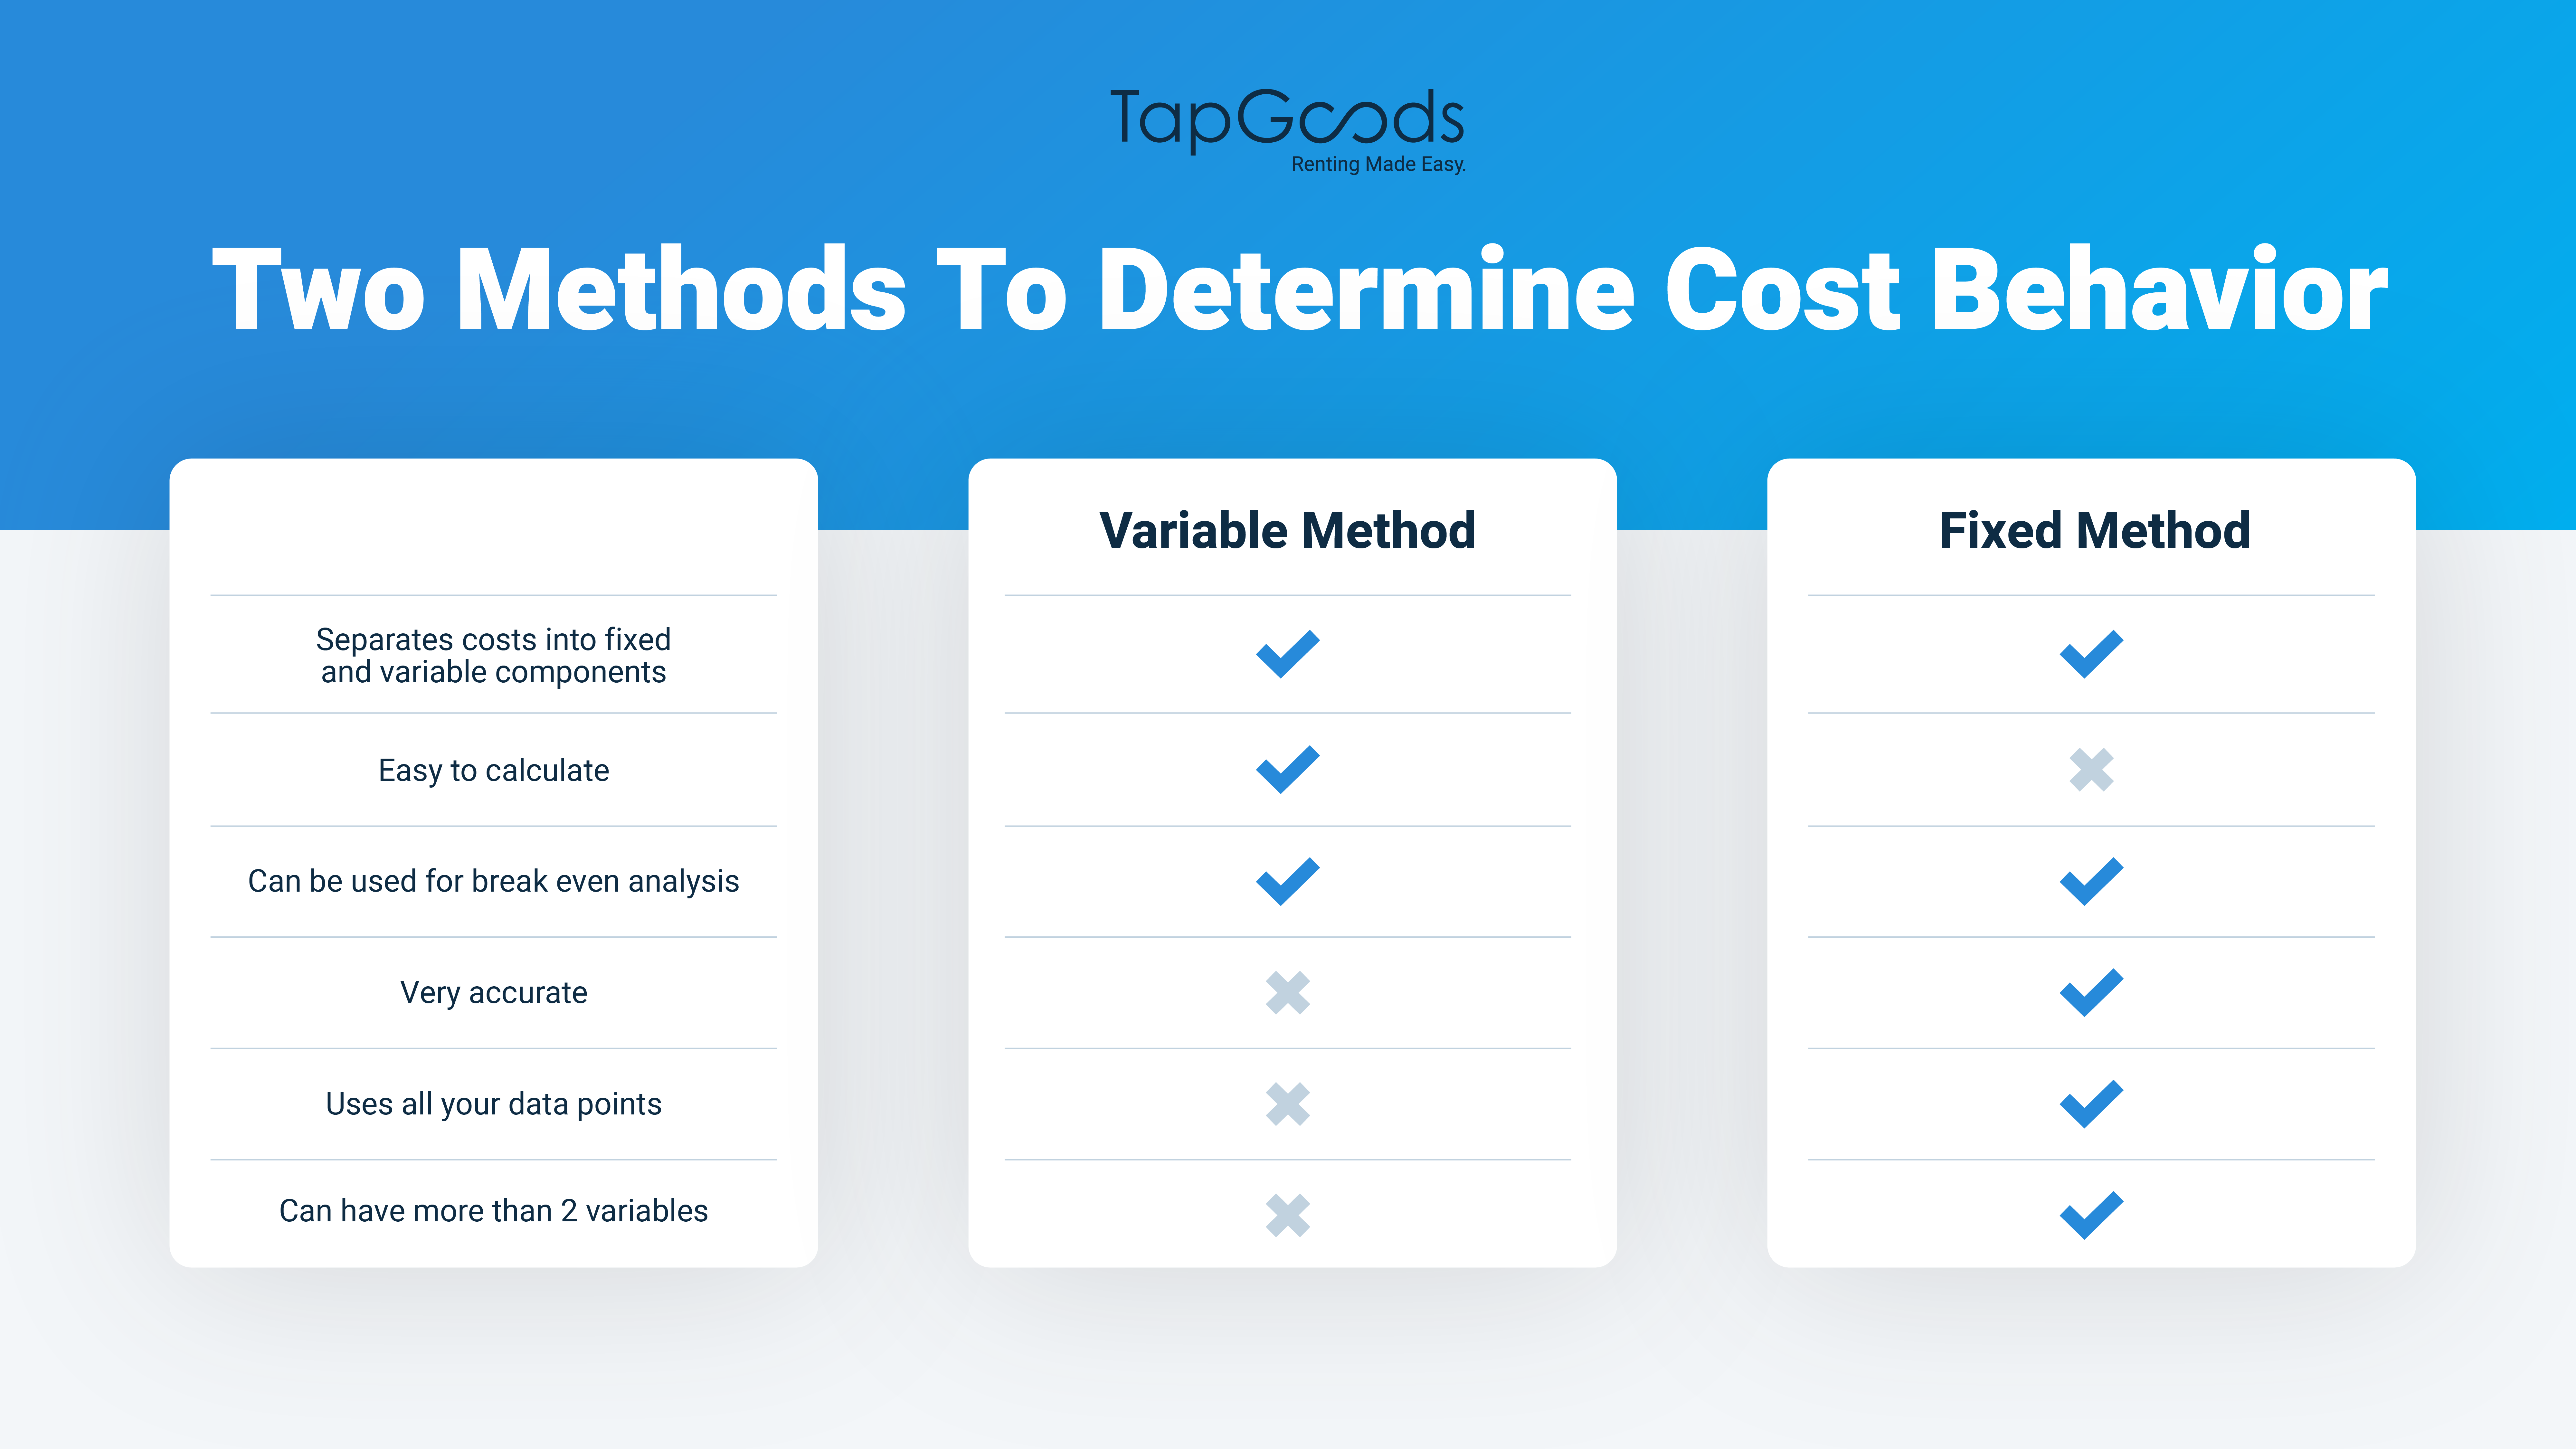
To figure out your costs, start by separating fixed and variable costs. You can use historical data and choose from two methods to determine the ratio of fixed to variable costs. Remember, these methods are most effective within a certain scale. Scaling your business significantly, like going from a $1 million company to a $10 million company, will alter cost behavior.
- High-Low Method: This simple method uses just two data points—your highest and lowest costs—to break down costs into fixed and variable components. It’s straightforward but less precise.
- Linear Regression Method: This method is more complex and accurate. It analyzes all your data points to distinguish between fixed and variable costs.
While I won’t dive deep into the mathematics behind these methods here, I’ve prepared a spreadsheet that simplifies the process. The spreadsheet comes with explanatory notes to help you understand how the calculations work.
Calculating Labor Price
Gather Your Data
Start by gathering your labor cost data. I recommend using at least 12 months of data for accuracy but be mindful not to use data so old that it doesn’t reflect current labor cost trends, as these costs tend to increase over time. Then, note how many orders you processed each month.
Here’s some fictional data for our example:
| Month | # of Orders Delivered | Labor Costs |
|---|---|---|
| Jan | 100 | $9,000 |
| Feb | 70 | $7,500 |
| Mar | 150 | $14,000 |
| Apr | 120 | $8,500 |
| May | 130 | $12,500 |
| Jun | 110 | $9,000 |
| Jul | 90 | $7,500 |
| Aug | 140 | $12,000 |
| Sep | 160 | $10,500 |
| Oct | 170 | $15,000 |
| Nov | 115 | $8,200 |
| Dec | 80 | $7,000 |
How to calculate your variable costs
Compare the highest and lowest cost months. The difference is your total variable cost. For example, the variable cost increase is $7,500 from a change of 100 orders, making the variable cost per unit $75.
In mathematical terms, variable cost per unit equals the change in costs divided by the change in orders. Our spreadsheet can automatically calculate this for you.
How to calculate fixed costs
take the total costs at the highest point ($15,000) and subtract the variable cost component ($75 variable cost per unit * 170 orders = $12,750).
The remaining $2,250 represents your fixed costs. Again, you can use our spreadsheet to calculate this data!
Segmenting Costs
To figure out your costs accurately, you need to look at different parts of your business separately. For jobs related to labor in rental companies, think about breaking it down like this:
- Pickup Orders: This is when the cost to get orders ready should be included in the price you charge for renting out items.
- Delivery Orders: Think about the cost of just delivering items.
- Delivery Orders with Setup: This is when you deliver items and also set them up. This should be its own category because it involves more work.
You can also split delivery orders into more specific groups. For example, orders with lots of items versus orders with just one item, or orders where you set up tents versus orders where you set up chairs. The more you break down these categories, the better you can understand your costs.
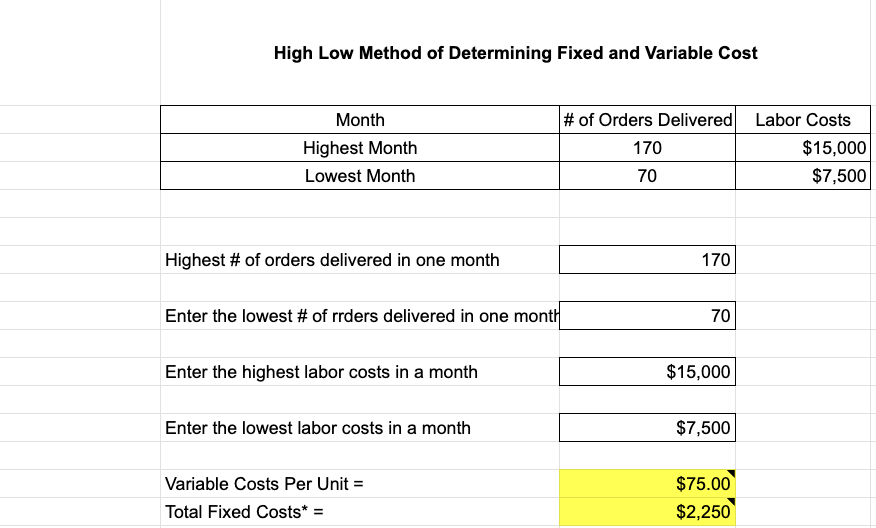
High-Low Method
The High Low Method uses two data points—the highest and lowest—to estimate costs, ignoring other data. This method may not fully capture your business model’s nuances. For instance, if these points are outliers, they won’t provide a useful analysis.
For a more precise data representation, the Linear Regression Method analyzes all your data points to establish the best fitting line, offering a clearer picture of your cost behavior.
Linear Regression Method
The Linear Regression Method, also known as Simple Ordinary Least Squares (OLS) Regression, uses all your data points (not just the highs and lows) to determine your fixed and variable costs.
The great news is you don’t need to do the math yourself; Excel and Google Sheets can handle it for you. The key to making informed pricing decisions lies in interpreting the results. I’ve prepared the formulas in Google Sheets, which is freely available to everyone, though Excel offers more advanced linear regression tools. If you prefer Excel, simply follow the instructions here.
To use Google Sheets, navigate to the second tab in the provided spreadsheet, labeled “Linear Regression Method.” Replace the sample data with your own, and the sheet will automatically update with your results.
Referencing the same data from our earlier example, you would see a scatter graph generated in the sheet, complete with a line that best fits your data points.
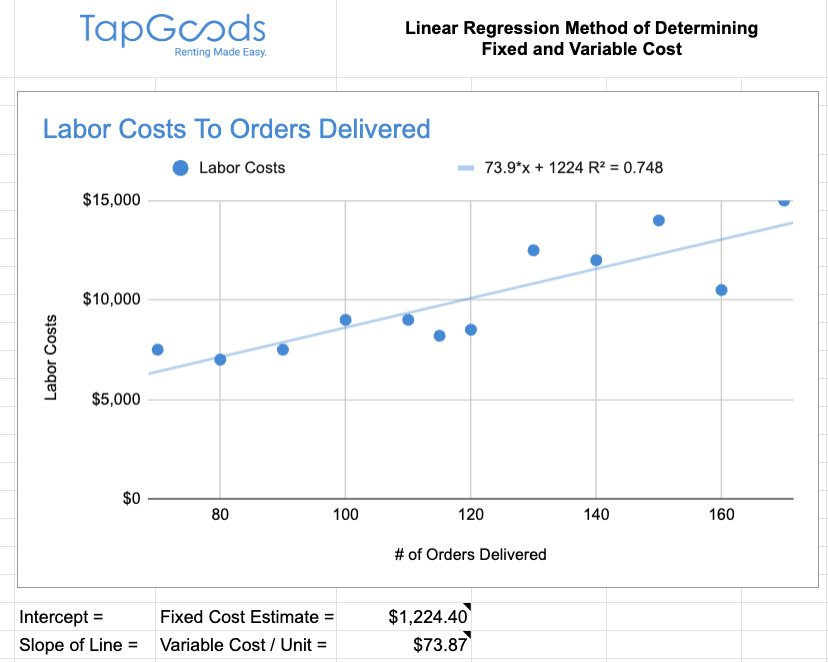
Here are three key metrics to focus on in your regression model:
- R-squared (R²) Value: Located at the top of the line graph area, the R² value shows how accurately the model predicts real-world outcomes. In our model, it gauges the correlation between the number of orders delivered and labor costs. For example, an R² value of .748 indicates a 74.8% accuracy in predicting labor costs based on the number of orders. The closer this value is to 100%, the more reliable the model. An R² of 0 suggests no correlation between the number of orders and costs.
- The Intercept (Fixed Cost Estimate): The intercept represents the expected total cost when there are no orders (x=0). It gives us the fixed costs, which are automatically calculated in the spreadsheet.
- The Slope (Variable Costs Per Unit): The slope indicates how costs vary with order volume. It measures the rate at which total costs change as the number of orders increases, providing a calculation of variable costs per unit directly in the spreadsheet.
While the high-low method allows for analyzing a single variable, the linear regression method can incorporate multiple variables for a more nuanced analysis. This is especially useful for assessing how fixed and variable costs might vary by the number of orders and time of year, for example, to adjust pricing seasonally. For multi-variable analysis, Excel is recommended over Google Sheets for its advanced capabilities.
To explore both methods, use the provided spreadsheet, which simplifies the calculations. Simply enter your data to see a breakdown of fixed versus variable costs.
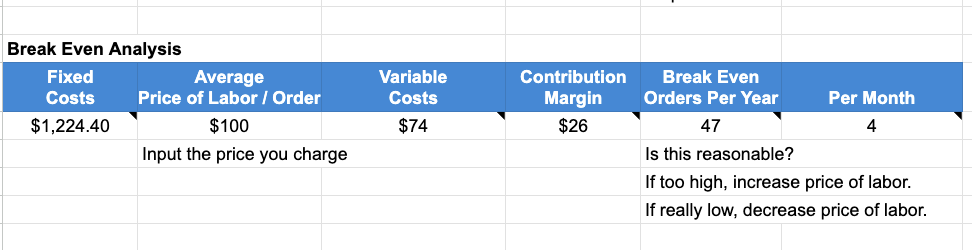
Break Even Analysis
The break-even section of the spreadsheet calculates how many units you need to sell to cover your fixed costs. The Contribution Margin represents your profit from each order after paying off your variable costs. For instance, if your labor charge is $100 and variable costs are $75, your contribution margin is $25.
You reach your break-even point when the number of orders covers all your fixed costs. In our high-low example, with fixed costs at $2,250 and a contribution margin of $25, it takes 90 orders to break even (90 x $25 = $2,250). Any orders beyond 90 bring in a profit of $25 each, since you’ve already met your fixed costs with the first 90 orders.
Understanding your contribution margin is crucial for maximizing profits.
How Much Should Rental Companies Charge for Labor?
Let’s quickly review the common types of pricing methods:
- Cost-Based: Now that you’re familiar with your costs and break-even point, you can apply a cost-based approach and include a profit margin.
- Customer-Based: Price your services based on what your customers are willing to pay.
- Competitor-Based: Set your prices by looking at what your competitors charge. You might choose to price lower to attract more business, higher to signal better value, or match competitors to neutralize price as a factor.
Combining all three methods is often the best strategy. Now that you know how much your labor costs, it’s time to add in some market insights.
Common Pricing Strategies
| Strategy | Description |
|---|---|
| Penetration Pricing | Initially set prices lower than competitors to capture market share. Used by newcomers to attract customers from established players. |
| Premium Pricing | Charge more than competitors to reflect the added value you provide, such as unique services that justify a higher price point. |
| Loss Leader Approach | Price certain items below cost to attract customers, making profits on additional purchases. E.g., low-priced tents with higher delivery and setup fees. |
| Skimming Strategy | Charge a high price for being the first to offer a specific service, until competition grows. Effective during high demand when supply is low. |
| Economy Pricing | Maintain a low profit margin, expecting volume sales to cover profits. Requires precise cost management to avoid losses. |
| Simplicity Pricing | Straightforward pricing, including potential extra fees, to enhance transparency and customer satisfaction. Inspired by Amazon's Prime service. |
Using the spreadsheet, play with the price you charge for labor and see how it affects your break-even point. You may choose to make changes such as using Total Labor Hours Billed instead of Number of Orders Shipped, which will help you determine what your hourly rate should be.
Set a Price, Then Analyze, Test, Adjust, and Repeat
To keep your business on track, it’s crucial to continually analyze, test, and adjust your prices. Don’t just set a price and forget about it. Mark your calendar to revisit your pricing strategy at least once every quarter, or at the very least, annually. Use your analysis, customer feedback, and a look at what your competitors are charging to refine your pricing approach.
Frequently Asked Questions
Fixed costs are the expenses your business has that do not change, no matter how many products you rent out or services you provide.
This includes things like the rent for your shop and your employees’ salaries. On the other hand, variable costs depend on how much business you’re doing. For example, if you have to deliver more items, you’ll spend more on gas and maybe even pay for extra helping hands.
To calculate your fixed costs, add up all the expenses that stay the same each month, like rent, utility bills that don’t fluctuate much, and regular salaries you pay to your employees. These costs remain constant regardless of your business activity.
To figure out your variable costs, track expenses that change as your business volume changes. This includes materials, extra labor you need for busy times, and transportation costs for deliveries. Look at these costs over different times or seasons to see how they go up or down with your business activity.
The high-low method helps you understand your costs based on your busiest and slowest business periods. You take the costs from your highest and lowest activity months and use the difference to find out how much your spending changes with your business volume. This can give you a rough idea of your variable costs per unit and help identify your fixed costs.
Linear regression is a more detailed way to analyze your costs using all your data, not just the extremes. It uses a formula to predict your spending based on how your business activities change. This method is great because it considers all your information, giving you a clearer picture of how costs behave as your business grows or enters different seasons. It’s especially useful for planning your pricing strategy because it helps you see the real impact of changes in your business volume on your costs.